
GIS Case Study
National Weather Station Network Portal
A public GIS portal visualising a national network of 300+ automatic weather stations in real time.
Domain
Weather Observation Network / Public Portal
Role
Full-Stack GIS Developer
At A Glance
What Makes It Work
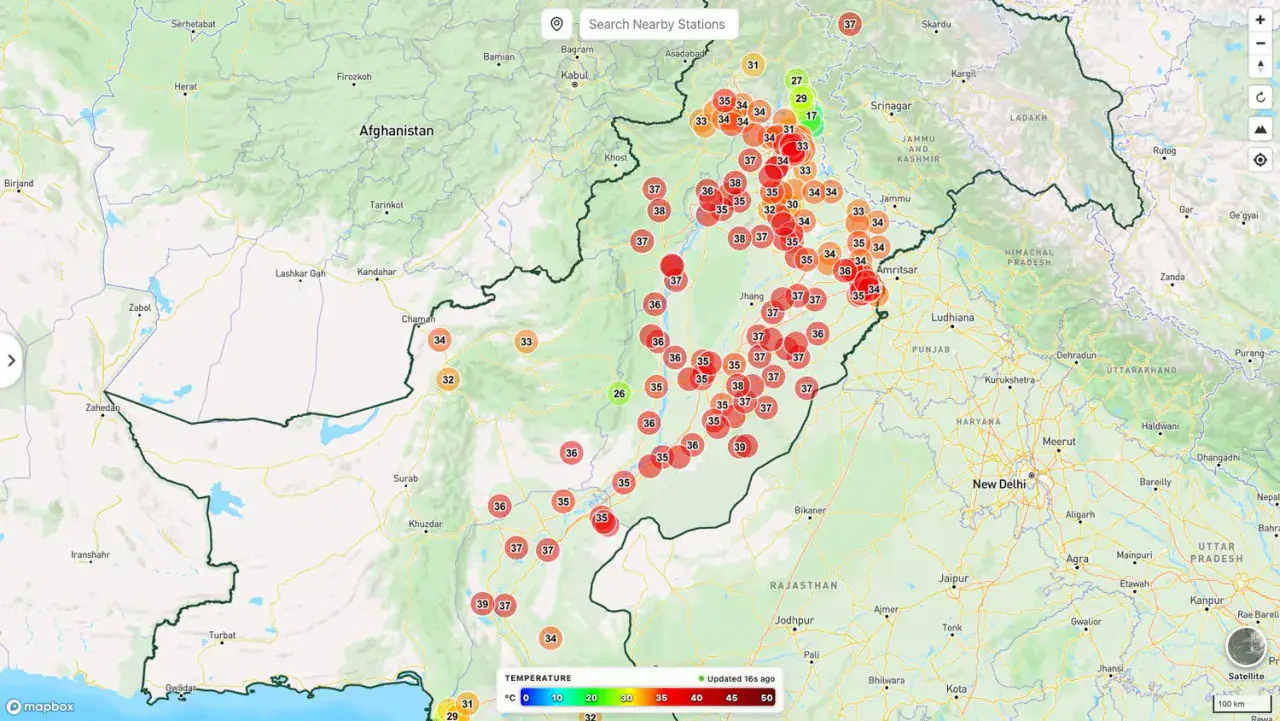
Live observations from 300+ automatic weather stations across the country
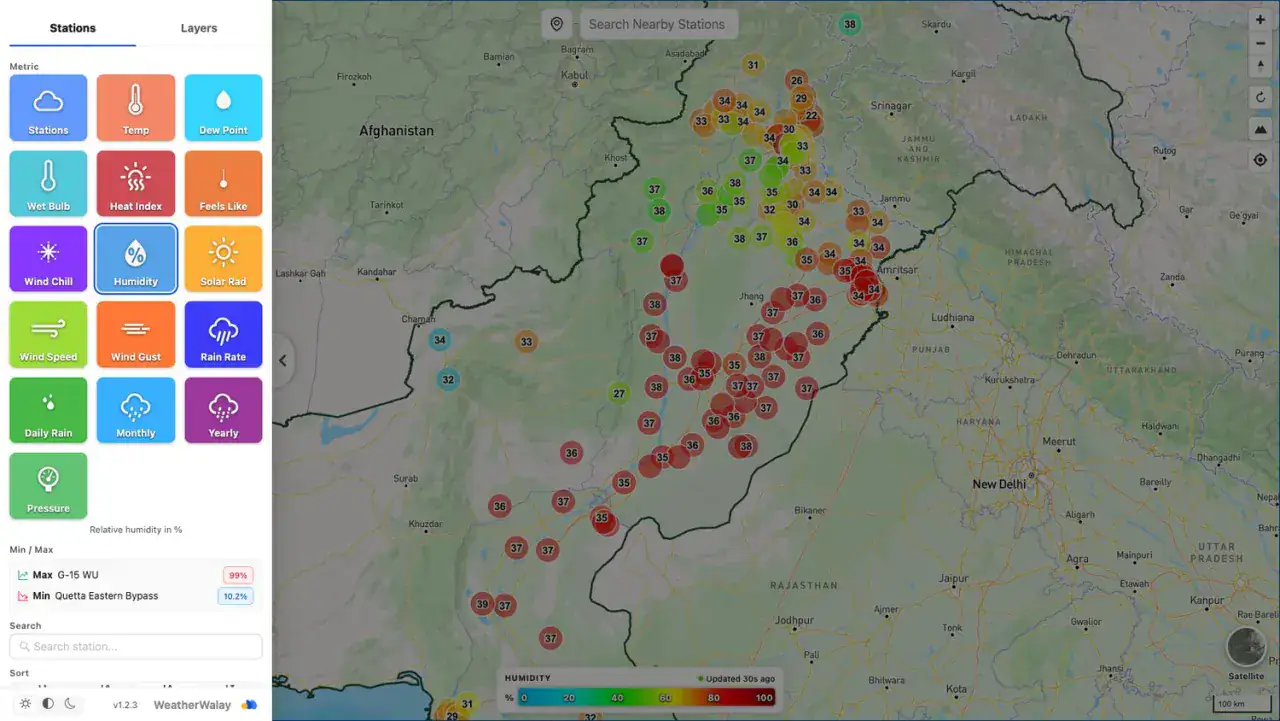
Sixteen switchable metrics — temperature, humidity, rain rate, wind, pressure and more
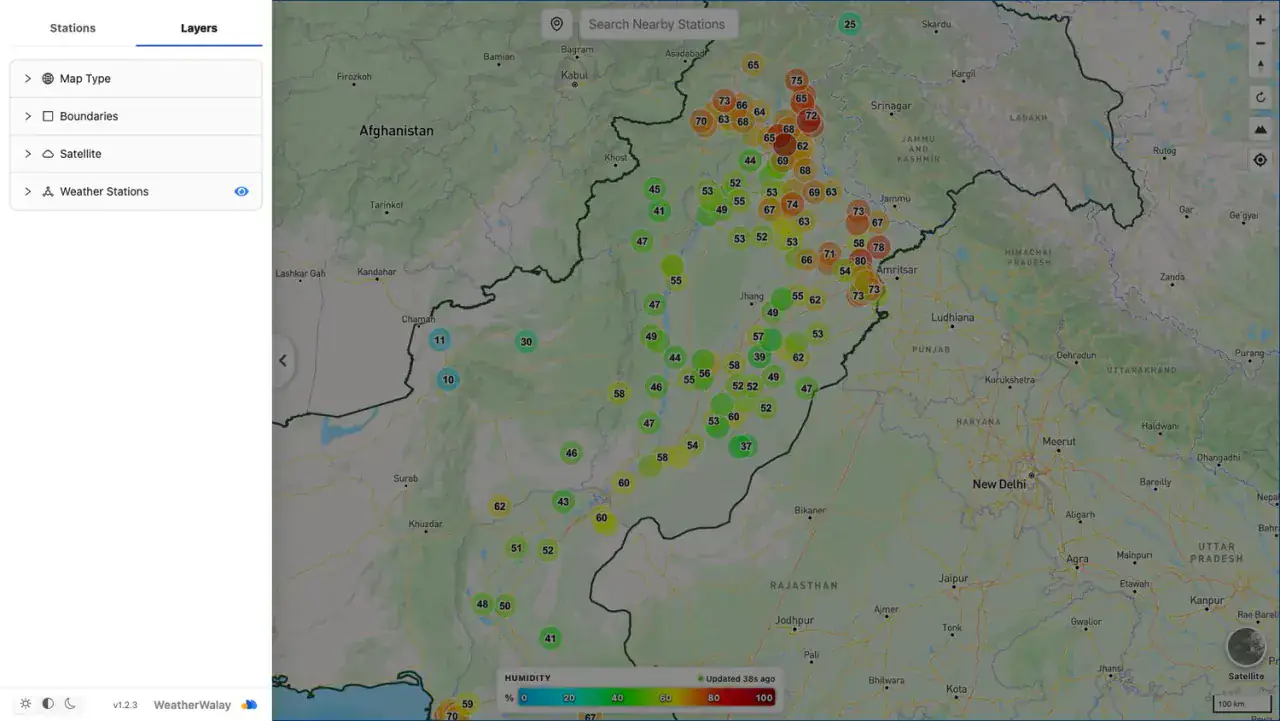
Satellite, terrain and 3D basemaps with a full layer and boundary tree
Auto-refreshing observations with a live data-freshness indicator
Capabilities
Core Functionality
Metric switcher across stations, temp, dew point, wet bulb, heat index, feels like, wind chill, humidity, solar radiation, wind speed, wind gust, rain rate, daily / monthly / yearly rain and pressure
Colour-graded station markers with a live legend keyed to the active metric
Network-wide min / max readout naming the extreme stations
Station search, sorting and nearby-station lookup by latitude / longitude
Layer tree covering map type, boundaries, satellite imagery and station visibility
Satellite basemap, 3D terrain and bearing controls
Light, auto and dark interface themes
Technologies
Tools & Stack
Product
From The Working Application
Portfolio
Explore More GIS Projects
Contact Us
Have A Project?
Let’s Build ItHave a project in mind? Tell us what you're building and we'll get back to you within 12–24 hours with a clear plan.
🔒
100% Confidential
⚡
12–24 Hr Response
🛡️
60-Day Bug Fix
✅
Free Consultation
💬
Start Your Project
Fill in the details below or book a call