
GIS Case Study
GeoGrid Analytics — Geodata Visualization & Analysis
A high-performance vector-tile platform for exploring and analysing very large geospatial datasets in the browser.
Domain
Utilities & Energy — Geodata Analytics
Role
Full-Stack GIS Developer
At A Glance
What Makes It Work
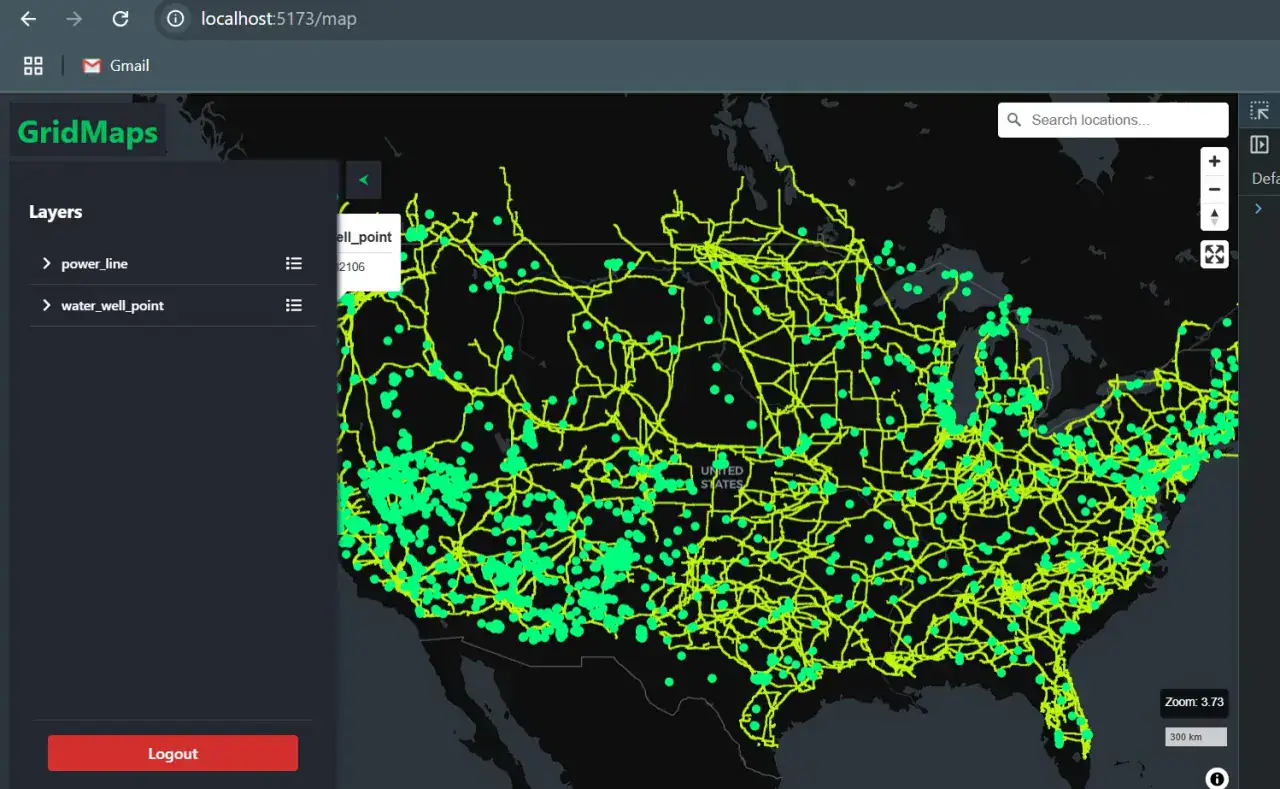
Renders multi-million-feature national datasets on a web map with no loss of interactivity
Vector tiles served straight out of PostGIS through Martin and Tegola
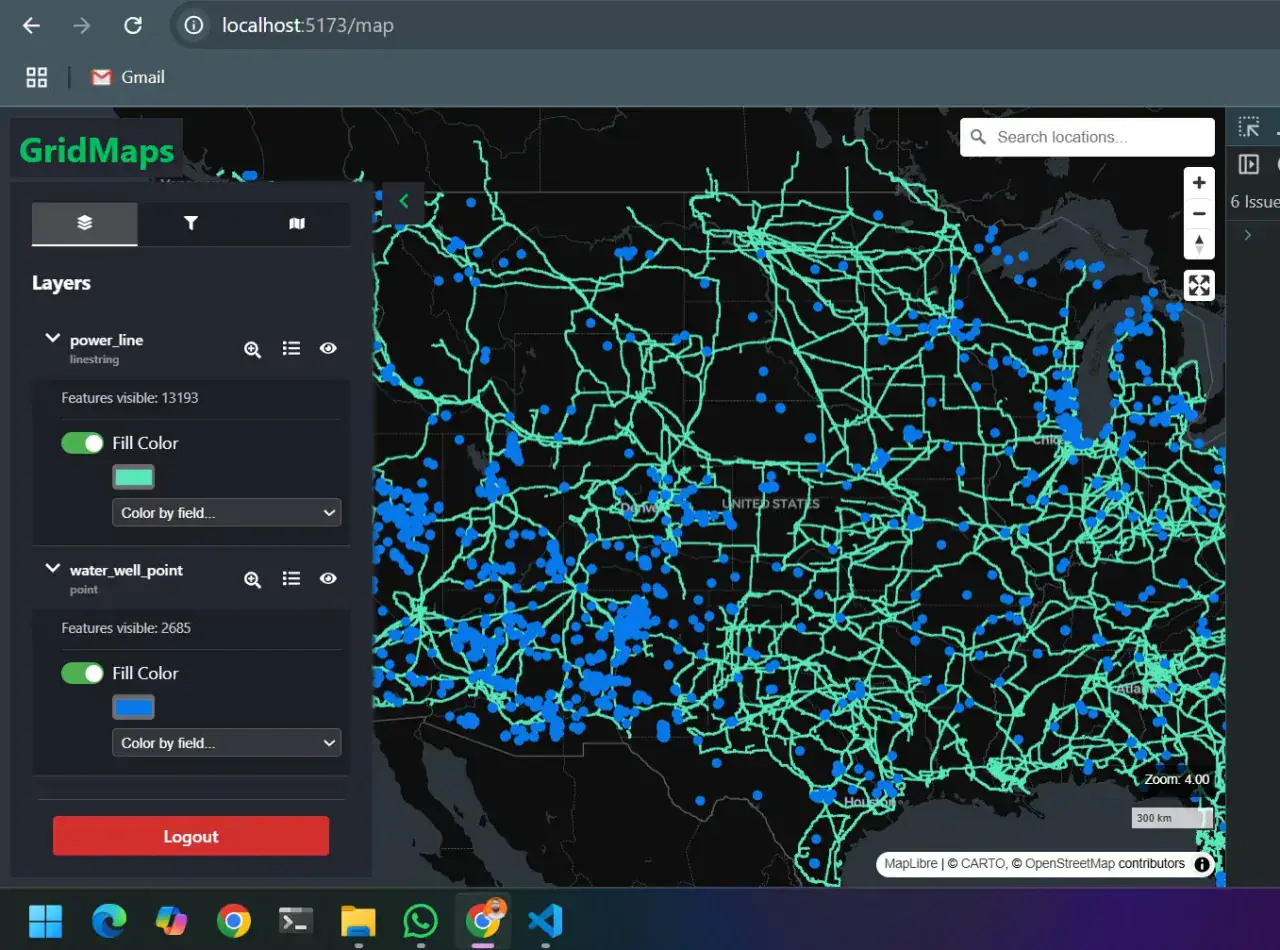
Live symbology control — colour ramps, categories, opacity and per-layer styling
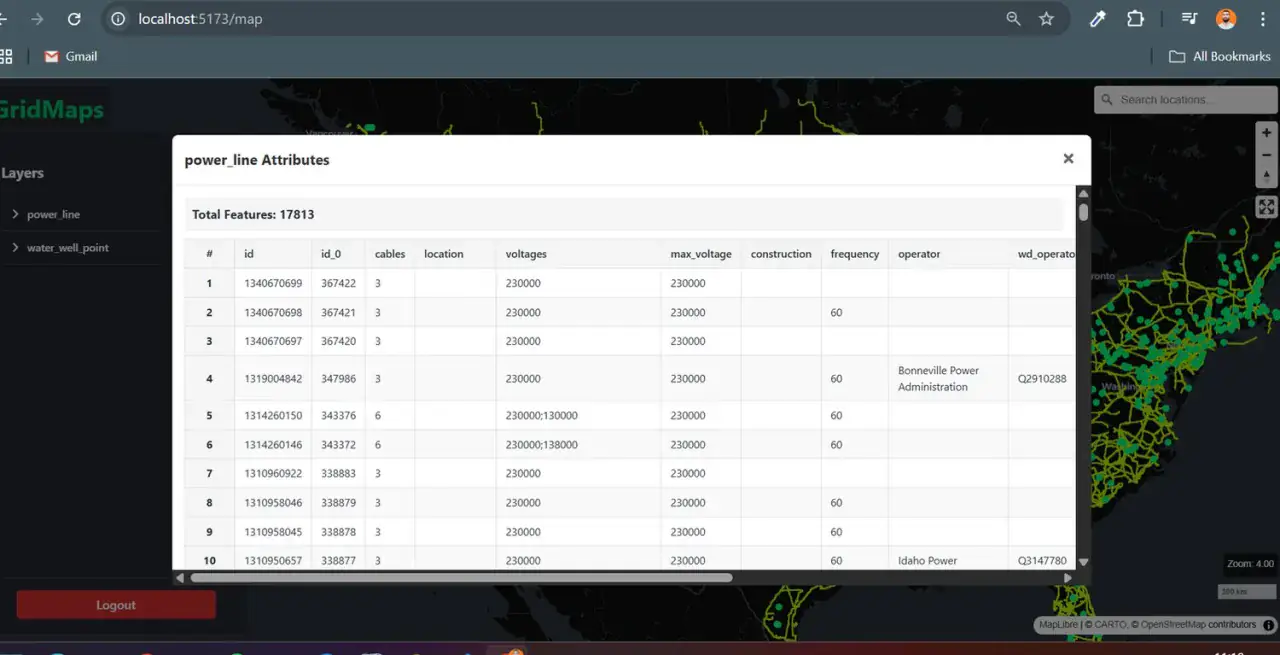
Attribute tables, feature inspection and on-map spatial querying
Capabilities
Core Functionality
Load and render heavy datasets — power lines, substations, wells, pipelines
Symbology editor with categorical and graduated styling
Attribute table with sorting, filtering and zoom-to-feature
Layer manager with visibility, ordering and opacity control
Basemap switching between satellite, streets and terrain
Feature identification with full attribute pop-ups
Default layer styles saved and reloaded as JSON
Technologies
Tools & Stack
Product
From The Working Application
Portfolio
Explore More GIS Projects
Contact Us
Have A Project?
Let’s Build ItHave a project in mind? Tell us what you're building and we'll get back to you within 12–24 hours with a clear plan.
🔒
100% Confidential
⚡
12–24 Hr Response
🛡️
60-Day Bug Fix
✅
Free Consultation
💬
Start Your Project
Fill in the details below or book a call